Monday, September 13, 2010

EUR/USD - Daily Gap Beggin for Some Love!

I know, I know... it has been awhile. It is still a very busy season for me, but thought I would take a few moments out to post what may be a solid opportunity forming in the EUR/USD pair. Gaps on the daily chart do not open up very often, and when they do, they are most often filled very quickly.

Will it be the case this time? I can't be sure with absolute certainty, but with today's large move having touched the daily upper bollinger bands with a daily gap up, I would be very very careful about buying into going long at this point. Looks like a scorcher to me!!!

Wednesday, June 23, 2010

Euro Update and Opportunity...

What seemed a bit tentative yesterday appears less so today.

I was looking for an impulsive 5 wave count, and while not the most perfect looking impulse, what appears to be an ending 5th wave thrust from a 4th wave triangle ended the wave has helped clear the picture and raise the odds a bit.


The spike up post Fed today is steep, and as I type, is close to being counted as a 5 wave impulse. I will count that wave as "a". The opportunity to go short will come with the completion of the "c" wave, which could take a day to play out.

One potential blip in the bearish case is found on the daily bolliger band chart I have been showing lately. This is the fourth time since the downtrend began last November that we have touched the upper band. Each of the 3 times prior, we spent 3-4 days flirting with that level. Now, there is nothing that says we must have a repreat performance, however, since we did not break the average (midpoint) between the bands today, and instead, this area acted as resistance, it may mean either a very healthy retrace of this first wave down, or that we will head to new short term highs before a return to the bearish trend.

For now, we are well within common wave 2 retrace levels, with a 5 wave pattern behind us that leads the path ahead until proven wrong.

Tuesday, June 22, 2010

Whose afraid of a little debt... the Euro is.

A brief reflective look at the Euro.

Short term perspective first.

Last Thursday the post "Not Even Going to Try to Count This..." described an rally set in overlapping waves. Two charts posted, the first with no elliott wave counts posted (I really tried, but it was just too much of a mess... one of the reasons why I believe that this will be fully retraced eventually), listing a prediction of a bounce to the mid 1.25's. The second a touch of the upper bollinger band on the daily chart. Here is what they looked like:


The top tick ended up being 1.2513 (this may differ from what your market makers data tells you since the top tick happened on traditionally low volume Sunday afternoon), and we now have what is beginning to look like an impulsive wave as a retreat.

Here's the daily bollinger band today:

Notice the perfect touch of the upper. The technical trigger using this method is a cross of the moving average/midpoint, so we are not quite there yet using strictly the daily bollinger.

We may have just finished (presently in a wave 2 up) or are nearly finished (another dip for a wave 5) with the first impulse wave down...


Longer term...
On May 22nd, I posted "EUR/USD Downside target realized, and then some...". At that time, I was exploring a very bearish option that has us in a wave 3 down since last November. While I have since shifted my view to one that places us in a lesser bearish C wave (see "Updated Longer Term EUR/USD View"), the internals of 3 vs C are the same.... a five wave impulse wave. Here is the chart from that post speculating on how wave 1 of 3 (or the entirety of C) would finish up.


This turned out to be precisely what the market had in store for us up until now.


Notice the sharp retracement of wave [iv] noted into the mid 1.20's. I believed at the time that it would be sharp because of the tendancy of waves 2 and 4 to alternate. In this case, since wave [ii] was a flat, then probability favored wave [iv] being a sharper corrective rally, more like a zig zag. If wave [iv] is finished, it probably counts best as a double or triple zig zag, but whatever the count, it certainly fit the alternation tendancy that Elliott describes. If wave [iv] is not finished, and we break through 1.2513 on solid momentum, it will likely mean my count is wrong. This does not mean that the bearish trend is over, only that the internal subdivisions need more time to work themselves out. I still believe we will hit that lower green trendline (very speculative) before monting a more significant rally.


Thursday, June 17, 2010

Not even going to try to count this...

What a mess. Your guess is as good as mine on the count, but with overlapping waves all over the place, I categorize it as a correction. The wave may stop at the area circles, but need a 5 wave move down to confirm a top.

If we break through this area, we likely head up to upper bollinger band before the wave ends... in the mod 1.25's.


Updated EUR/USD Long Term View

It has been almost a month since my last post. It is good to be back. While the business of trading continues, my time has been limited for posts due to vacation, illness, endurance training, house remodels, and other business ventures.

Needless to say, I have been a tad overbooked.

The market has been anything but unexciting during the past month. Before I get back into the shorter time periods, my longer term analysis is in need of a refresher.

Take a gander at the longer term view I posted back in March of this year.

The counts I described are all well intact, and with the latest month worth of price action, a count has moved into the forefront as most likely, that we are in an ABC correction down from early 2008 highs.

Because we have broken through below the end of wave A at 1.2328 it is entirely possible that the entire ABC correction is complete and that we are about to embark on a new bull market that will carry us to new highs. It is possible, but I do not believe it is the most probable scenario just yet.

The shorter term counts favor at least another dip to a low before bottoming, and the rally action over the last week or so looks corrective in nature... certainly persistant, but not impulsive. And we are still within the area of the previous 4th wave, a very common retracement area. No impulse means it is most likely corrective, and probably a 4th wave of the entire move down from last November highs. 


Additionally, notice the parallel trend lines (green) built off the highs of 2008 and late last year in the chart below. There is a cluster of support created by where this lower trendline crosses 61.8% retracement of the previous 5 wave rally to 2008 (1.1205), and the 78.6% fib fan from the previous 5 wave move intersects. This is an area that acted as support back in 1997-98 during a bear market. The other area I am watching is the low of late 2005 at 1.1659. Also important right in the middle of this price area is the point at which C equals A, 1.1434. There is a common equality relationship between the A and C waves in a correction, especially in a zig zag formation.

So, my target for wave C to end is between 1.1205 and 1.1659, with an emphasis on the area around the equality measure of 1.1434.

The alternate count is very, very bearish. If it is indeed the true count, the Euro is in for a very rough ride ahead, and may not survive the fall. This is the count that Prechter believes is in play. I am not quote ready to get that bearish yet. We'll explore that option in more detail if we cross below the previously cited major support areas.


Wednesday, May 26, 2010

Diverging RSI

Often, when there are conflicting elliott wave counts that are both likely, additional indicators such as RSI can help push the probability of one as "most likely" into the spotlight.

Today is one such instance.

Yesterday's chart has two potential counts listed.

Thanks to diverging RSI while the Euro hit a new short term price low, I now have more confidence that the count listed today is squarely in the top spot. It is not that the alternate is not possible (it still is), it is simply that the primary is so much more likely.

Since we did not yet hit a new low and so far, the late afternoon rebound appears to be in 3 wave form, look to a new low after perhaps more consolidation up towards 1.24 (or maybe even higher) over the next few hours to a day in a wave 2 move. The alternate mentioned yesterday also has us rallying short term... a little higher though above 1.2675 to complete wave c of wave (iv) in a flat before the next bearish wave begins.

Tuesday, May 25, 2010

EUR/USD... Bottoms up!

The correction since the May 19th low counts clearly corrective as an ABC (or WXY if you prefer). The decline that has follow is so far only in 3 waves and has not yet hit new lows. Primary count I am following has us hitting a new low in a 5th wave before another change at a longer term correction. However, because the move down is so far only in 3 waves, an alternate count of a potential flat correction as a possibility which would have us moving higher is still on the table. A move below May 19th lows would eliminate this count, whil a move above 1.2340 would render the more bearish count highly improbable.

Keep in mind though, that even if the more short term bullish flat correction interpretation is correct, we eventually will find new lows. A move higher above last weeks high of 1.2671 in 5 waves, without hitting new lows under 1.214 would be yet another opportunity for the bears.


Thursday, May 20, 2010

Euro: Classic Elliott Wave Patterns

I have rarely seen elliott wave patterns so clear as they have been in playing out over the past months in the EUR/USD pair.

I have always found that elliott wave is easiest to trade where volume and volatility are present. Volume is needed to capture the largest social mood patterns, and volatility to amplify the patterns so that it is easier to see in real time. As the heaviest traded currency pair in the world the EUR/USD meets the volume characteristic needed, and the volatility over the past months due to the sovereign debt crisis surely has amplified the patterns.

The moves over the past 24 hours since my last post are no exception. The market has moved almost precisely as Elliott guidelines and wave patterns would indicate. Anyone who doubts that Elliott wave cannot assisst in helping narrow the possibilities of where the market should head, or just simply believes that markets are entirely random and unpredictable needs to see the past few days charts.

Yesterday had us in a clear 5 wave pattern off new lows for the EUR/USD (new 4 year lows in fact). Elliott wave analysis indicated that we should see a correction back to the area of the previous fourth wave and toward the common fib retrace area starting at 38%... followed by at least another 5 wave rally to new highs in a wave c or 3.

Here is yesterday's chart:

  
Here is today's chart:

The wave ii or b low of just below 1.23 is both within the are of the previous 4th wave, and squarely in the fibonacci zone. More important, is that its wave structure was overlapping in its form and in 3 waves. This was a significant clue that made going long near these levels relatively easy with defined risk (for me, the max risk I was willing to take was the end of the fib zone near 68% retrace level, but a wave 11 or b could have gone all the way to test the low and still have been valid, albeit much less probable). The reward happened as elliott wave predicted in a wave 3 or c move up to new highs.

Wave 3 or c is either over or has one more pop up to new highs before it is complete. Warning to the bulls though that the move down on the ultra short term charts can be counted as impulsive, so caution is needed.
Once wave 3 or c is completed (if it is not already), it becomes critical to watch the pattern of how the market corrects the move... if impulsive in 5 waves down, the we likely head to new lows before another shot at rallying. If in 3 overlapping waves, then we indeed be in a 4th wave and headed back up to complete the 5th wave of the move off the lows. Should the latter happen, it would mean a larger rally was unfolding, after a 3 wave correction.

Time to watch carefully and plan the next strategic trade...

I will be at a conference all day tommorrow, so no posts until next week. Good luck to you all and be careful out there. Volatility and risk are back in full force! 


Wednesday, May 19, 2010

Euro - 5 waves down followed by 5 waves up

 Yesterdays post warned that 5 waves down on the hourly charts was nearly complete and that we would likely be heading for a rally to at least correct the impulse wave down occuring since 1.304. The post proved timely as within the hour the EUR/USD began rallying. The post also mentioned the fiurst significant support at the area surrounding 1.2425.

The rally appears to have completed or nearly completed 5 small degree waves up, and has stalled near 1.2425. This indicates that the trend at some degree has changed. To what degree is unknown. I have placed both options for counts on today's chart, but we will have to wait and see. Until then, I will keep laser focused on the short term charts for hints either way. Until then, we are in for a correction of the EUR/USD rally likely to fib areas which also fall in the price area of the rallies 4th wave. For those of you who are new to Elliott wave analysis, this is a common retracement area for 2nd waves, so I will be watching this area for support. If I was still short, this would be a respectible area for me to exit my shorts and either wait for more clues or go long for the next wave up (whether it is a c wave or 3 wave doesnt matter to us very short term traders).

My gut and the fact that the latest low was not accompanied by a decent RSI divergence has me leaning toward the ABC option for this rally (more downside to come before a more significant rally), but I will let the market show me the way.


Tuesday, May 18, 2010

EUR/USD - 5 Small Degree Waves Down...

Forecast yesterday was right on as we plunged into a new low this morning.

I can count 5 waves down as being completed or very close to being completed since last weeks high of 1.3094 on the hourly charts for EUR/USD. So, irregardless of the larger counts, we are very near at least a break in the downward trend for now. Still no sign (five wave impulse upward on any timeframe) of a bottom as of this writing however.


Previous fourth wave area surrounding 1.2425 will be the first siginificant resistance for any bounce to encounter.

As for me, I am watching and waiting for the structure of any bounces that develop. It is time for caution and risk to prevail.

Monday, May 17, 2010

EUR/USD Downside target realized, and then some...

Back from a very restful vacation taken during one of the most volatile times in the market in memory. Equity markets dropping 9%+ in a matter of minutes a week ago Thursday, and the Euro seemingly freefalling through support levels of the past few years.

I must admit, I did keep an eye on the markets, and even placed a few short positions in the EUR/USD... I couldn't resist. No posts though... had to keep my family commitments first!

Clearly, the Euro has blown clearly through the target of 1.289 in mid-May I had posted back in March... and it did so without much resistance at all, which throws the entire idea of a lower yellow trendline (shown for the last time below) holding back selling pressure. And this morning, another breakthrough to 4 year lows! What a time to take a vacation!

Since it has been awhile since I have posted my position on elliott wave counts on the EUR/USD, rather than dive right back into the short term charts, I thought I would get back into the swing of things with an update on the minor degree count I think is most probable governing the trend since last November, and speculate a bit about where I see the market possibly moving from here.


The biggest change in the minor count I am following is that it appears that wave 5 is extending. It is very common for 1 wave to extend in an impulsive wave, and since wave 1 and wave 3 are nearly equal, it is ideal for me in identifying the larger wave structure that wave 5 extends because the presence of an extension reinforces that we are indeed in an impulsive wave. 

There are certainly other more bearish counts from some very smart analysts. One of which has us in the throws of an intermediate wave 3 after a series of 1-2's. I would rather not go into the pro's and con's of other views right now, and would rather stick with the one that has made the most sense to me along the way beginning, and has worked out very well for trading purposes.

This count has some more downside ahead moving toward a completion of 5 minor waves down (intermediate 1 wave completion), which I speculate will be followed by an intermediate wave 2 that if it is an ideal second wave, should last for a few months and take us into the most common retracement fibonacci levels and end within the previous minor wave 4 price range.
  

Tuesday, May 4, 2010

Longer term view prediction getting closer...

Here is the target and prediction I put forth on March 22nd. That we would hit the trendline near 1.289 in or around the mid-May timeframe. While it took wave 4 much longer to play out than was apparent on March 22nd, the market appears to be attracted to the lower trendline like a magnet.


Notice the yellow trendline support.

Here is where we are today. Notice the blue trendline that has held all price action for months is not broken to the downside. Yellow trend channel target dead ahead!!!


Shert term analysis in yesterdays post I mentioned an opportunity with a bounce to 1.3206-1.3250 to go short for a wave 3. Here is what the chart and count looked like yesterday...


As such, my best count is that we are in a wave iii of wave (iii) of wave [v] of wave 1, thrusting from a completed triangle, and on our way down to a touch of long time trend support. Wave iv and wave v are still ahead, but downside is now becoming limited before a much larger expected rally that could carry us to at least between 1.38 - 1.40 in a 3 wave correction of the entire move down from last November. This correction will serve to scare the now overcrowded, weaker shorts into long positions... just in time for wave 3.

Monday, May 3, 2010

A week later... Euro still declining

My apologies for no posts in a week. Unfortunately, I got hit with a viral bus in the shape of acute bronchitis and laryngitis... a very nasty combo. Almost as nasty as the combo punch that continues to decimate every Euro rally since last November. And if Elliott wave counts are correct, we still have a bit more to go on the downside before a more sustainable rally to correct the primary trend down.

Last Monday I mentioned that a new low was likely. Sure enough, we did hit a new low shortly after. On Friday, April 23rd post, I had posted that there were 2 counts that were most probable to explain the price action over the last month and a half... an ending diagonal 5th wave or a diagonal (or some call triangle) 4th wave... with the diagonal 4th as the most probable.

Today's short term action still has both firmly on the table and the likelyhood of new lows is clearly ahead of us. Here's the primary count I am following:


This has us in a wave ii of wave (iii) of wave [v]. Wave ii could take us near support in the prior fourth wave of 1.3206 - 1.3250, but it would take a break of last nights high of 1.3362 to move to the alternate, still bearish option of an ending diagonal 5th wave. The only difference in the alternate is some additional upside, likely to near 1.3450 prior to dropping down for a new low. A solid risk/reward opportunity on the short side is presenting itself with a near term bounce in 3 waves.

Although the short term is pointing clearly down, we are quickly heading into a time where a longer lasting bounce may be around the corner. My longer term EUR/USD model is still in play, and I fully expect a significant bounce to begin off the lower support trendline. The trend is down, but moving to a more cautious stance soon is certainly called for and wise.


Monday, April 26, 2010

Monday Update on the EUR/USD

Last Friday's count is still very valid, and little new information added with today's price moves to swing the analysis one way or another.

What does seem to be probable is that after hitting new lows last week, the move upward seems to be in corrective form... which means eventual new lows once the correction is finished. We will have to wait and see more price action for specificity on the short term count.

Notice the rally stalling out right at fib 38% area. I think we will see more upside to this rally due to 3 waves on the short term charts.

Friday, April 23, 2010

Euro Rebounds... but for how long?

If you have been following these posts, you know that I have been bouncing back and forth as to whether we are an ending diagonal 5th wave, or a diagonal wave 4th option. Both are similar in form, but with the breakthrough yesterday to new lows, and what would have to be a very shollow "e" wave of the triangle, the ending diagonal view took the spotlight. The diagonal 4th is still the most likely alternative, but if we break through 1.3524 to the upside, the diagonal 4th option is completely off the table.

The selling didnt quite reach the lower blue line as I was anticipating yesterday, however, after doing some more analysis overnight, I realized that a touch of the blue line on the bottom would have eliminated the ending diagonal option completely, as wave 3 would have stretched out to be longer than wave 1 (a rule breaker in Elliott rules). The bounce that played out overnight was critical to the ending diagonal option.

Ending diagonal's are very rare and only take place where the preceding moves have gone too far, too fast. The Euro's move down from 1.51+ last November to 1.32 could be described as such a move. Even still, because of the rarity of seeing this pattern, and even more rare being able to identify it in real time before it is almost complete, I will continue to be vigilant in moving alternatives to the front and center as they become viable.

Thursday, April 22, 2010

EUR/USD Breaks Through to New Low!

I was watching for a new low and now we have it, and with a nice break of both the short term (green), and long term (white) trend channel lines. And so far, I do not see signs of the downtrend diminishing. Because we have not had a significant counter-trend move that I have mentioned might take place over the last few days in what could be called a "wave e", I have lowered the probability of the diagonal 4th wave pattern that I have had as primary over the last week, and gone back to the ending diagonal 5th option from last week.

There are always alternatives in elliott wave analysis, and it is sometimes challenging to know which one is playing out in real time. From my recent post though, I hope everyone has been taking away the most important lessons I have learned while trading using elliott wave... when both the top and alternate scenarios are pointed in the same direction, you can be wrong on the exact pattern and still have winning trades.

Again today the difference matters very little for the short term. Likely more room to the downside. The next area to watch for for this round of selling to end is along the lower blue trendline, which is currently declining through 1.3120. I will be specifically watching for a crossover in the MACD, and a divergence between new price lows and RSI extremes to help judge whether the trend may be changing.


Wednesday, April 21, 2010

EUR/USD - "D" wave of diagonal continuing...

It appears that wave "d" of the triangle has extended (of wave iv), which was the alternate discussed in yesterday's post. Look for a bounce over the next 24 hours to start forming wave "e" of the triangle, up to between 1.3550 to 1.36. Should the selling continue below the purple trendline support without a bounce into that area, chances increase that wave iv is already over and that wave v has begun heading to new lows. Either way, the name of the game is watch for opportunities to place short positions.

Note the various trend channels I am watching on different timescales. I adjusted the green and purple slightly earlier yesterday. The blue has remained unchanged for over a month. This upper channel line has provided significant resistance. A break above would likely mean a much more significant retracement of the entire move down from last November highs.

A break below 1.328 would eliminate most remaining bullish alternatives, although even without the break these are very low in probability.

Tuesday, April 20, 2010

EUR/USD diagonal wave in motion...

There are a few options for the patterns lately on the short term charts, but the overall pattern has displayed 3 wave movements in either direction, which is a sign of a diagonal... the move preceding the final in a sequence.

Primary short term count favors the down trend, with an (e) wave ending this morning or with an allowance for some additional upside to make it to resistance above 1.3550 before wave (e) ends.

Alternate is still the diagonal, but had wave (d) still in progress.

Monday, April 19, 2010

Monday Morning Euro Update

From my post on Friday...
"If we are in a triangle, wave D will probably end along the white line, and probably someone in the neighborhood of 1.34, before a 3 wave bounce in a wave E."

And here's Friday's chart with trendlines...
https://blogger.googleusercontent.com/img/b/R29vZ2xl/AVvXsEjjUXJ7IuwC9esh40mAHKQc1MR6YCgXHqwPrd-774W2E8aAz1gnaYU5YobMUHaA0uHYGBeRhu2wHLYRyX9WpE7dNRZAhCfl1t1OFnGeatocqq0By_3k1RjrpiNXtWF9zykN9WOu4SpSVgF7/s1600/EUR45.png

The only addition I have made to this mornings chart is a new potential green channel, which at the moment, looks like it may be simply a slope change of the yellow on the way down to touch the white. The alternate is that it may be the beginning of wave "e" of a larger 4th or B wave triangle (see my post last week for details on this count). If we break through the upper green, this is how I will be viewing the action. Wave "e" could move into the 1.3550 area, which I would see as an opportunity on the short side as long as it is in 3 waves.


Adherance to trends why I love trading the spot forex market, and even more, the EUR/USD.


Friday, April 16, 2010

Iceland, Greece, now Goldman?

Fear has been back in the markets since last November, although by looking solely at the equity markets, one would hardly know it. It is only upon review of the Euro, the dollar, and other major currencies, one gets the sense that there are serious fears being acted out in the markets.

The Euro has Greece, and while the possibility of Greece's default is significant, it is much, much, much, much, much (is that too many???) more significant in what Greece may signify... a tip of the iceberg of foreign nations defaulting. Ironically, Greece has had much wider coverage in the international news, but last year, Iceland sounded the alarm. That fear alarm has driven the EUR/USD pair down significantly from it's highs up over 1.51+ to a recent low of 1.32+. That's about 13% drop in a little over 5 months! A large move in any currency.

Equities back in 2007 had Lehman Bros.... the straw that broke... well, you know how that story goes. Today's announcement about potential Goldman fraud does not surprise anyone I have talked to, but it does point to fears that so far since 2009 lows, has so far been able to be ignored. I am no expert in derivatives, or the complex financial arrangements that surround them, but I do know that noone has a solid grasp on the amount of leverage they represent in the global marketplace... and hence, the impact of a chill on these bets such that the Goldman news today may represent.

I digress though... as a non-expert on all things Goldman, and merely an Elliott wave analyst and part time trader, I will leave the deep dive into such matters to those with more experience. I point these relationships out... that between Iceland, Greece = Euro, and Goldman = Equities to merely show that fear, the everpresent necessity of a bear market, does not show its ferocity all at once, at the same time, in the same marketplace. It has peaks and valleys. This is the root of a grand supercycle bear market elliott wave. The valley of the absence of fear in the equity markets may have just passed.

Binve has a great post on elliott wave counts (short and long term) in the equity markets. I highly recommend checking his latest post out. He has had a minority view that the latest wave up (since Feb) was NOT impulsive (which I had agreed with)...

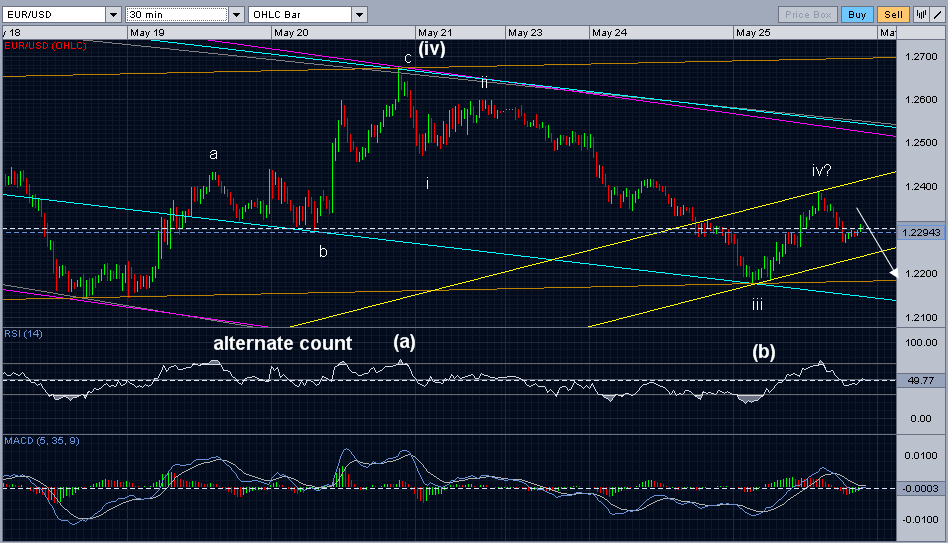
As far as EUR/USD action, the bearish triangle or ending diagonal counts of late are still in effect. No need to change things here. The short term picture appears as if a small degree 5 waver has or is near to ending, which may mean a partial retracement of the move down from the upper blue trendline.

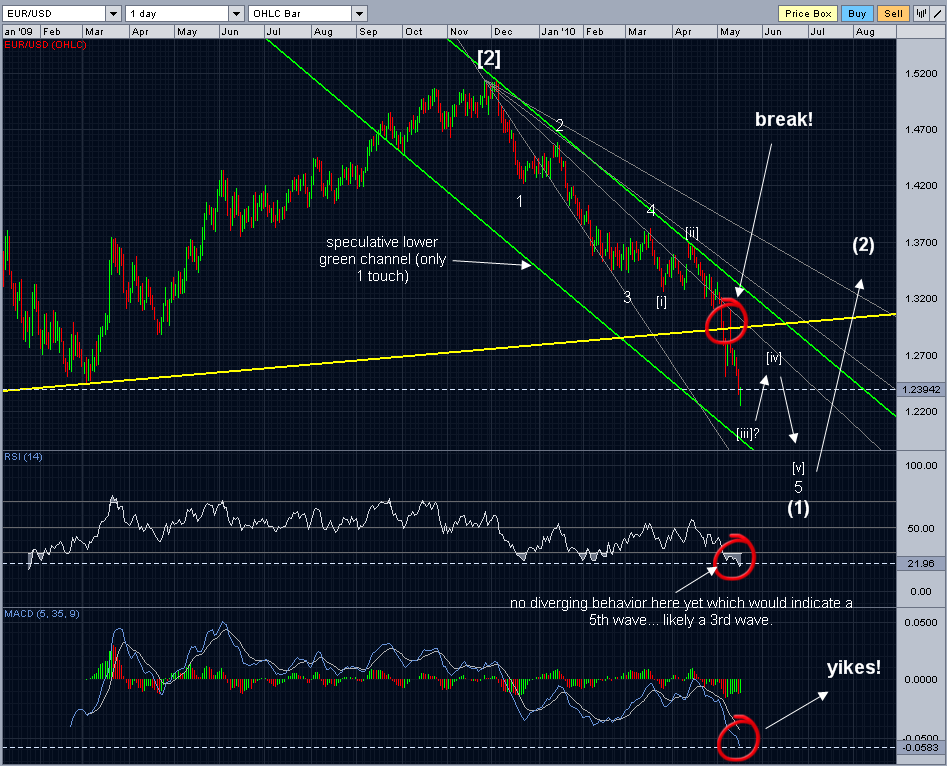
I thought I would show the various trendlines that may be in effect that are very solid tools at finding support and resistance levels.


The white line represents the recently broken upper trend channel that has guided price action since last November highs. Yup, it has been broken (with a gap up that was just closed today), but I would keep an eye on this line as it is common for breaks to retest.

I have spoken a lot about the blue trendlines shown. These have a number of touchpoints on the upside, and will be a formidable barrier for the bulls to try to break.

The purple is a so far weak upward bound trend channel. It may provide some resistance on the way down, but given the non-impulsive nature of the rise off last months lows, it should not hold for long.

The yellow lines are very short term trend lines. The most speculative of the bunch, a break of the upper would tell us that a short term trend change is in effect.

The red line isn't a trend channel, but rather represents my line in the sand for the bearish scenarios. If my analysis is right, price will not move above this level.

If we are in a triangle, wave D will probably end along the white line, and probably someone in the neighborhood of 1.34, before a 3 wave bounce in a wave E.

Will indicators a bit oversold, and RSI diverging on the latest lows on the short term indicators, my guess is that profits have been taken for the week and we won't see much action until open on Sunday.

Have a great weekend!

Thursday, April 15, 2010

Euro's got the blues.

EUR/USD declined again overnight, keepoing the bearish short term counts I have been showing on track. Most important from a technical perspective in my analysis, is that 1.3536 was taken out early this morning, negating the one bullish scenario I could come up with to explain the action off the lows of 1.326 last month (see alternate count post from Monday this week).

That clears the potentials a bit, and lends much more confidence to the likelihood of hitting new lows sooner rather than later, keeping me focused on the two bearish counts (see most recent post yesterday).

The short term picture is mixed however, with the action down from this weeks 1.369 high (touching off the blue trend channel) looking very corrective so far. I have included a micro count showing a possible impulsive wave that may be in progress, but I don't have high confidence that once this micro pattern completes, that we will head down to new lows without hitting another high above 1.369, before heading down. If we do, I continue to view this as an opportunity to go short.

With the larger patterns tipped clearly to the side of a new low in the near future, this may be one of the many cases in trading where watching and waiting may pay off with a solid entry position for the next leg down.


Wednesday, April 14, 2010

Ode to a EUR/USD Bear...

Well, my short term great short term trade opportunity from yesterday was proven wrong with a move above 1.3627. It appears we still have another move up above 1.3691 before the move we are in completes. This would break the blue upper trendline that I have been showing, and but me on the defensive to watch out for a more bullish alternative. The short term bullish count from last week has not changed, and is still an option, but prices would have to move above 1.3816 to clench this as the top option.

So many options, what to do? Corrective waves are fun trying to identify, aren't they? Take a look at the 2 bearish counts below:


What apears to be 3 wave movements in both directions, possibly since what I show as wave [iii]. Primary count is the ending diagonal wave [v] which is what I have been following, but a solid alternate is potentially a triangle wave [iv] still in motion. Triangles are common corrective patterns as the wave preceeding the final wave of a sequence. Usually either a wave 4 or a wave b. If this is indeed the pattern, it may raise the probability of a different longer term count... and [a][b][c] correction. This is the count that my good friend Binve and most of the long term dollar bears are following. If we break through 1.3266 (the low so far this year) without bouncing up in a wave e first, then the ending diagonal maintains its primary status. For now the short term direction of both the patterns is effectively the same, but I thought I would bring the pattern into your thoughts to see the most likely possibilities.


Tuesday, April 13, 2010

A study of a solid elliott wave trade setup...

Not much new to report on the wave structure, so I thought I would show you a short term setup that has me interested. Counts from yesterday are still intact, with overnight range bound action. I am considering an alternate, more bearish scenario that may have us still in a fourth wave, but waiting for more evidence from the market to seriously consider.

Take a look at the 1 min chart below:


I circled the areas that have me interested, as an elliott wave analyst.
  1. 5 Waves down from a short term high
  2. MACD rolling over at the peak
  3. Wave iii of iii with peaking RSI
  4. Wave v RSI diverging
  5. Retracement into common fibonacci area
  6. Retracement has the appearance of a corrective wave

Where I have labeled wave (ii) or (b) I have an allowance for the pattern to morph into an more complex corrective pattern that will retace a bit further of the previous wave, but the message stays essentially the same.

A solid example of a potential trade setup on a very short term chart in real time. Placing a trade near the peak of wave (ii) or (b) allows risk to be limited to the peak of wave 1 where I know that I am wrong (elliott rule that wave ii cannot go beyond the starting point of wave i)... awaiting a wave (iii) or wave (c) to short term lows.

I am a big fan of this type of setup, no matter the timeframe. Hopefully, this one works out in my favor!

Monday, April 12, 2010

EUR/USD Touching the blue line...

The deep blue hue of the Pacific Ocean is unmatched by any color I have ever seen. The fish were not biting all that much, but the weather, company, and experience will be fresh in my memory long after the fillets have all been enjoyed.


I left the ocean and fishing lines behind yesterday to discover that the EUR/USD had indeed touched off on the upper blue trend channel line I had first mentioned in my post on 3/31/10, and then most recently mentioned again in my post last Tuesday, April 6th.


Whether the price action will fulfill my longer term EUR/USD count remains to be seen, but for now, the primary count in play remains either an ending diagonal for wave 5, or a yet to be seen impulse. If the latter is in play, we need to see some serious impulsive looking wave 3 down very soon... where things stand right now, I rank this option a distant 3rd in probability. The alternate is the bullish scenario (larger degree wave 2 in motion) I have been showing off and on since March 15th lows. It is possible to count an a-b-c flat correction for wave 2, followed by an impulse for wave 3 (or the start of wave 3 up). A clean break through the blue upper trendline shown would move this option up in probability, but it would take a break through of 1.3816 clenching this as the primary option.

Wednesday, April 7, 2010

Gone fishing...

This will be my last post for the next few days as I am taking a much needed break to do some deep sea fishing. Yellowtail and rock cod are in my thoughts, and this year has many rumblings of a record season due to "El Nino". Oh, the fish stories I will have to tell...

Overall, it has been an excellent time to be an elliott analyst/trader focused on the EUR/USD pair. The patterns have been about as clear as I have ever seen them, and the counts have been relatively easy to trade. While I am relishing in such good fortune, I am also cautious of such ease. I have said it before, and will probably repeat myself a few more times... we appear to have 5 waves down from last Novembers highs. While the internal structure of the 5th wave does not quite look complete, it is now 3 weeks along it's path. Whether it turns out to be an ending diagonal, or a straight impulse move remains to be seen, but the move is heading into its latter stages. That doesnt mean that I am will stop shorting, but it does mean that I have shifted my priority to risk management first (see my recent post on managing risk).

My latest short term ending diagonal count from yesterday is still in play, so no need to update the internals quite yet. SInce I will be out of pocket for a few days, and we are near a potentially critical juncture, I thought I would post a chart of the overlapping fibonacci fans that have made up wave 5 so far, and leave you with my current thinking of potential courses the market may take.

Based on the current count I am following, we are in a wave 3 of 5, which should take us down to new lows over the next few hours. Once that breach takes place, I will be looking for support near the blue lower trendline to give a bounce (a wave 4 of 5). If it does not, and price action moves through with strength, then I would move the odds away from an ending diagonal for the 5th wave and instead to a clean impulsive wave. In the unlikely event that we begin rallying and break through the fibonacci fan that I have should with strength, BEFORE we see new lows, then I would begin to look for evidence of a corrective wave (something in 3 wave form) toward the upside that does not exceed 1.359... I would call that move a small degree wave 2 of wave 3 of wave 5. This move may happen even if we do get a new low, especially if RSI is not peaking, so I would watch for it.

Bottom line is that the trend is still down as long as short term rallies are corrective in nature, and selling patterns look impulsive. Simple, right? Stay safe... will post again on Monday.

Tuesday, April 6, 2010

Since the Panic of 2008 - Comparing Gold, the Dollar, Stocks, Bonds, and the Euro

It's August 2008, and the financial world is in chaos.
Talk of bailouts, Lehman Brothers, Bernanke, and Paulson is everywhere.
The stock market market is well off it's 2007 highs.
Oil and gold have recently reached all time price highs.
There is talk of a dollar crisis.
The panic is palpable.
Welcome to a Grand Supercycle Elliott Wave correction in social mood.
You question yourself, and your investment advisor almost on a daily basis, "Is my money safe"?
Noone seems to have any certainty for the road ahead. You make a decision to change your investment strategy...
Depending on your trusted information sources, beliefs, and bias', your decision might have lead you into one or more of the following asset classes:

Gold
Cash (dollars in my case since I live in the USA)
Stocks
Bonds

Now, almost two years later, and I thought I would take time to measure the results and ask myself a few questions.

Below are the results of each of these asset classes (including the EUR/USD currency pair) from the view of % return on an investment made in August 2008.


In my investing and trading life, the best lessons are learned through honest self evaluation and a strong strategy that forms as a result.

Are these results what you expected them to be? If yes, what guided you to success? If no, what were the critical mistakes you made?
 
MY ANSWERS:
Results for Gold the Euro and the dollar were pretty much as I expected them.The Euro bounced a little higher and for longer than I thought, and Gold has held up better than I thought in spite of the recent dollar rally. The long bond (represented by TFT on the graph above) and stocks (represented by SPY on the graph above) held up much better than I expected. I truly underestimated the power of the last bull market/asset mania to carry through this correction. I invested in stocks starting last April, but only for a few months.

Which asset classes will be the winners among these over the next two years? Why do you think so?

MY ANSWERS:
The dollar will continue to mount it's mid term comeback (and its inverse, the EUR/USD will continue to decline), albeit not in a straight line... we may be heading for a correction soon (my longer term view here). Stocks and Bonds will be heading to first test, and then break through to new lows likely during this time period. Gold will likely test it's long-standing lower trendline which has support below 700. Whether it does so after another new high or before I will leave to the daily gold bugs.

Three primary reasons for my viewpoints:

  1. Social mood has shifted the human herd significantly, the impact of which cannot be stopped... only delayed (see what really moves markets here).

  2. Round two of deflation in risky assets has begun (Elliott Wave International has a free 13 page report that you might want to read on the subject here). More debt is denominated in US dollars than any other currency in the world. Round two of a run from riskier assets has started with the Euro this time around. Banks and financial institutions had risky asset holders in the world scared during the first round. Stocks, Gold, and Euro all sold in exchange for dollar safety, and to use dollars to pay off dollar denominated debt. We are already starting to see sovereign nations at the center of the start of the next round (see 3 Dire Options for Greece). Longer term, I see severe issues with the dollar...

  3. Long term elliott wave counts on each of these asset classes (binve has a solid long term view of stocks, gold, and the US dollar here). 
What views do you hold for the next two years?

Euro fears = Ending Diagonal Wave 5

With the break this morning through 1.338, it appears that the small degree wave 2 count that has been my primary count since last week (see Tues. March 31st post ) is indeed in play. It also means that the primary and alternate counts I am following are both telling the same story on a short term basis. The primary difference between the two is whether an ending diagonal is in play (see last weeks ending diagonal speculation post ), or a more bearish impulsive count. Clarity on which one is in motion should work itself over the next day... it is a close call between the two given that the correction moved up into a very common ending point for wave 2's... between 50% - 61.8% fibonacci retracement zone, and that we never did get a touchpoint of the upper blue as noted in my speculation last week which would have put the ending diagonal at a much higher probability.

A break through of 1.3459 to the upside would warn that a more complex wave 2 was progressing (and that we may still hit that blue upper channel!).

Even though the trend looks like it is still clearly down, I would be remiss if I did not point out that we are most likely in the ending move (wave 5) of the entire wave down since last November. Once wave 5 is complete, I would expect to see a significant rally. I continue to read more and more articles about the record number of short EUR/USD positions in the market. As a contrarian study by nature, any elliottician reading such news with an almost textbook 5 wave pattern in it's later stages, must prudently consider the risk and manage money tightly.

My longer term EUR/USD count may be worth reviewing at this point to give you some perspective at where wave 5 may take us before a larger corrective rebound that retraces some portion of the down move since November.

Monday, April 5, 2010

EUR/USD in 3 Waves...

Action since last week has been very choppy. The move up from 1.326 does not look impulsive. This is good news for the Euro bears and bad news for the bulls. I have changed the short term counts a bit and the yellow short term trendline (still not a high level of confidence in this channel yet), although neither of these changes significantly affect the forecast. There are numerous ways to label short term counts, but the bottom line is that the move up appears to be of the 3 wave variety.

There may still be more upside, as I still think it is possible for us to reach the upper blue trend channel in a triple diagonal move (see last weeks ending diagonal speculation post), even in the primary overall bearish count I am watching. We may drift lower to touch the yellow in more of an X wave before heading up to an ending Z, but this is very specuylative. 1.3382 is a critical point in the short term counts, and should we breach here, we likely head down to new lows.

Thursday, April 1, 2010

EUR/USD - 1st & 2nd Counts Head Higher for Now

Updated counts from today's action. A few key points:
1) The upside count does not look complete.
2) The blue trend channels I drew Wednesday may be a stopping point, if the ending diagonal 5th option (primary count shown) is in play (see yesterday's post)
3) I don't have significant confidence in the upper yellow short term channel. It may be higher than I have shown.

Bottom line is that since both primary and alternate counts head upwards, we should be looking that direction in the short term. I am watching for a touch off the upper blue channel, or a break of 1.3459 and then through 1.3385 prior to a touch to confirm the start of a next leg lower under the primary count.


EUR/USD - More short term upside possible.

I am remote today so no charts with this update. I will post an updated chart with elliott counts this evening when I get back to a computer. Take a look at yesterdays update, "Ending Diagonal Speculation". With the persistent number of buyers over the last few days, and what appears to be ABC moves in both directions, I am thinking that this may be the top pattern. Key to this (ending diagonal) option is that the rally does not turn into a 5 wave affair. If it does, odd favor that the entire bearish (dollar bullish) move from last November is over for now.I will be looking to potentially short the euro again should it get near the upper trendline shown in the ending diagonal post yesterday.

Wednesday, March 31, 2010

3 Options for Greece... All With Dire Consequences

Taken from the article Hans-Werner Sinn: 3 Options For Greece

"There are three bad alternatives. He recommends #3 (effectively, default):


1) A Franco-German bailout. Dr. Sinn believes this is impractical and the worst of the three alternatives because the amounts required for an effective bailout are so large that it would trigger a jump in yields on French and German sovereign debt which would result in a Euro-wide financial crisis. In addition, Angela Merkel said 'no,' and so did Guido Westerwelle (her coalition partner and foreign minister).

2) IMF loans. Dr. Sinn believes that this would accelerate the Greek economic contraction with a dramatic deflation of wages and prices, which could lead to civil war, revolution and a political destabilization of the area.

3) Exit the Euro zone, revive the Drachma, re-denominate the sovereign bonds in Drachma, let the Drachma collapse, and rebuild after the collapse, largely on tourist remittances Assuming a small amount of domestic (internal) default, this would be the least-painful to the Greek populace, but German banks and investors would lose approximately $38 Bn in bond investments +/- what can be recovered after the Greek economy recovers. Eventually, Greece would be allowed to re-join the EU."
 

Ending Diagonal Speculation...

Taking a bit of time to indulge in future speculation surrounding how the market may fulfill the EUR/USD Long Term View Target from current levels.

The blue trend channel lines are distinct possibilities. Two touch points on the upper and lower channels so far (see analysis of triad indicators supplementing Elliott Wave), and an Elliott count that so far, counts best as 3 waves down to new lows (see 3/30/10 EUR/USD Elliott Wave count). This opens the door for a slop change and an ending diagonal for wave 5.

What do you think?

EUR/USD: The story remains the same...

Not much new to report. The primary count I am following is still intact showing us in a short term wave 2 of 5. The mention yesterday of a possible very short term 5 wave down was proven incorrect by the market this morning so it looks like prices will be heading toward 1.36 before completing wave 2 and entering the next leg down... wave 3.


See yesterday evening's post for the active euro elliott wave count:
3/30/10 EUR/USD Elliott Count

Caution should still be exercised due to the more bullish alternate being shown... that wave 5 is complete and we are entering a multi month rally that partially retraces the move down from 1.51+ that started last November. It would take a move above 1.3813 to confirm that this alternate more bullish scenario was in play, although a break of the upper trendline area surrounding 1.3650 would be an early warning sign.
Ping your blog