Thursday, August 11, 2011

Equity markets in freefall... what is next?

It appears that my last post on July 1st, "Why I can't be long term bullish on US Stock Markets" proved timely. Since that time, the S&P has been in virtual freefall territory in a move down where at it's lowest earlier this week, the index had shed over 250 points in a little less than a single month. A very, very big move. Since plumbing those depths earlier this week, we have had back to back wild swings of 4-5% reminisscent of late 2008. The natural question to ponder is... what do the next days and weeks hold?

Having ventured already into the long term picture and my perspective, lets head into the shorter term. I do not have a crystal ball, and will not pretend I can. I can only operate with a strategy to label possibilities as more or less likely to try to take the subjectivity out of trading as much as possible.

Let's take a close-up look at the S&P on an hourly chart with 2 possible sets of fibonnacci fans set up and a possible trend channel formation on the downtrend and on the potential uptrend currently in formation.

A few items we can get out of the way very quickly. So far, this is a 3 wave move on the hourly charts. If it truly is to remain a 3 wave move, then the market will rally above the low of the first wave at 1293 BEFORE it moves to a new low below 1101. If not, then it can be counted as a five 5 move. Simple enough. I have included a trend channel to the chart as well. Ideally, a fourth wave move will touch the trend channel line and then head to a move below 1101 to complete five waves. This last part is a guideline, not a rule...

So, are we in a 4th wave or have we just ended the C wave of a 3 wave move down?

Honestly, I don't know yet. But we can drill down into a shorter term chart to look at the action since the 1101 bottom earlier this week for clues.


What does this tell us? So far, there are 3 clear waves up... the first (lets call it an A wave for now) is the blast up from lows on the 9th in the final hour of trading that day. The second (B) ended at yesterday's close. The 3rd (C) is still in progress or just ended at today's high (the selloff right before the close is hinting that the wave may be over). It also shows me that while the entire move up hasn't yet touched the downward trend channel line that I have drawn (as of the close of today sloping down through about 1230 in the S&P), it can be counted as a completed 3 waves.

With 3 wave moves down on the hourly charts, and only a 3 wave move on the upper charts the ball is still with the bears for the moment hinting at a return to new lows to complete a 5 wave move down. I would like to see this wave get to the downward trendline before heading down to give more of an ideal structure. It still may get there, but if it does so, it will likely need to do it in a more complex correction if what I am calling wave C is over.


Friday, July 1, 2011

Why I can't be long term bullish on US Stock Markets...

I really, really, really want to be bullish. Truly I do. I love America. My sister was born on July 4th, 1976... my grandparents lived the grapes of wrath in moving out of the dustbowl of OK to a better life for themselves in CA. The values of working hard and getting your hands dirty to build a life, a business, and a community is in my blood. Perhaps it is for these reasons that I have a very hard time accepting the current uptrend of the US stock market as "real"... that is, as a real indicator of future growth and prosperity ahead of us rather than the result of crafty financial gamesmanship at the highest level of the land.

Am I biased? You bet I am! But I would be willing to place my bias aside if I could venture into the market index trends and find a reason that my bias should be rejected and shunned in my long term investment decisions. But each time the market rallies these days, I find myself venturing back to the long term charts just to make sure that my long term horizon viewpoint is still founded in good practice. Why not come along for the ride. First stop... the Dow Jones...


Arguably, this is the most bullish of the 3 main indexes I take a look at. 3 indicators I review... RSI (measure of momentum), volume, and price. Without getting into an elliott wave analysis, there are a few simple things that I can follow and that are very compelling to tell me what is happening. First, the momentum in the rally since 2009 is absolutely pathetic as compared to what existing at the top in 2008, and in 2000. In fact the top of RSI occured in the late 1990's. Also, if you zoom in a bit, you can see that momentum on the last leg of the rally from last years flash crash timeframe until today did not reach a new high while prices did. Volume is likewise diverging from price. Could we get a lasting bull market on successively lower volume? It is possible, but I can;t find one example to look toward in the indexes that would show me this is likely. In fact, the opposite is true... bull markets grow because more and more people buy into them over time. The rally from 2009 till today has less and less stocks changing hands. Does this mean the market will turn down tomorrow? Certainly not, but these divergences are profound and continuing to grow wider.

Next stop... Nasdaq...


Here too we have diverging RSI and volume, and in addition, we are rapidly closing in on an upper trendline formed by connecting the 2 lows of the index in the past decade, and by creating a parallel top trendline off the high point of 2008. Certainly the trendline is slightly up, but we are near the top of the trendline and still well below the all time top of the index in 2000. There are high probability elliott wave patterns in play here that help guide me to thinking a new low will be here eventually (perhaps after a test of the upper trendline), but I promised to keep elliott and his waves out of this post...

Last stop... S&P...


Different index, same story. Diverging RSI and volume. Trendlines heading down, and very close to testing the upper trendline.

The conclusion for me is simple. If I wanted to gamble on the market long term, today would not be the day. Should we break through the upper trendlines of the indexes with increasing volume and momentum, then I would absolutely change my mind and consider investing. Untill then, simply watching and waiting and working with my hands to build a better life for my family. Have a wonderful fourth of July. Take a moment if you can this weekend... between the BBQ's and fireworks, and really think about what you truly want from your country, and what you are prepared to do with your own hands to make it happen. We need more do'ers in this day of virtual everything. And doing comes from first sincerely putting some thought about what you want to change next.

Happy Birthday America!

EUR/USD at a crossroads...

Time to look at the longer term daily charts. The market is about to reveal to us the nature of the rally off the lows it registered last June... impulsive 5 waves up... or corrective 3 waves up. The new few weeks will be very important to the implications for the larger trend, so it is time to be watchful.

First chart below is the daily chart for the past year. I have included the elliott wave counts that I have been following along with trend channels and the standard RSI and MACD indicators that I use to judge where I am in the elliott wave counts and the momentum of the trend.


As you can see above, it appears that we have 2 impulsive waves off the lows back in June 2010 with a correction in between. The price action off of the recent May highs becomes critical... will it be a 4th wave, with a 5th to follow to new highs? Or is it the end of an ABC correction and beginning of a new trend down. Notice when the peak in RSI and MACD happen... they peak at where I have labeled the "3" of the first impulse wave. The RSI and MACD are also both clearly narrowing.

I have seen a number of counts pointing to a triangle with the count somethin like this...


Or this (same message short term, different longer term implications)...


1.427 is a absolutely critical level to the first of these bullish triangle counts (bold red line in chart). Elliott wave rules do not allow a 4th wave to enter into the territory of the 1st wave. Triagles are common 4th wave structures and are allowed to enter into the price territory of the first wave as long as the endpoint of the "E" wave of the triangle ends above the 1st wave territory... in this case at the level of 1.4277. If we break below, this count is proven incorrect. However, a triangle or flat can still be forming based on the second bullish count. Prices would have to fall below 1.385 before these counts are off the table. Personally, I view this bullish option as less likely... the 4th wave is very large and long in the tooth as compared to the second wave.

There is another count I am watching that is bullish on the very short term, but bearish further out. It looks like this...


I like this count for a number of reasons. The RSI and MACD peaking on the first wave? Possible, but not likely. They also are creating a divergence with price which many times is a warning sign that prices are peaking and about to head the other direction. Also, take a look at the bold blue trendline that we burst through to the upside prior to May's peak. Many times after a break in a trendline, the market will send prices back down to test that trendline before deciding on its future path. It happened last year (bold green trendline), and it is likely to happen again. Also, the purple tren channel seems to be forming which would make a nice stopping point for a wave 2 (or wave B if you prefer). If we break through 1.469 to the upside, I will be watching any resistance that this trendline has for opportunities to go short... especially if the above triangle scenarios are eliminated first.

Bottom line... I am watching the action over the next few weeks very closely to clues to help me eliminate counts. You should be too!

Monday, September 13, 2010

EUR/USD - Daily Gap Beggin for Some Love!

I know, I know... it has been awhile. It is still a very busy season for me, but thought I would take a few moments out to post what may be a solid opportunity forming in the EUR/USD pair. Gaps on the daily chart do not open up very often, and when they do, they are most often filled very quickly.

Will it be the case this time? I can't be sure with absolute certainty, but with today's large move having touched the daily upper bollinger bands with a daily gap up, I would be very very careful about buying into going long at this point. Looks like a scorcher to me!!!

Wednesday, June 23, 2010

Euro Update and Opportunity...

What seemed a bit tentative yesterday appears less so today.

I was looking for an impulsive 5 wave count, and while not the most perfect looking impulse, what appears to be an ending 5th wave thrust from a 4th wave triangle ended the wave has helped clear the picture and raise the odds a bit.


The spike up post Fed today is steep, and as I type, is close to being counted as a 5 wave impulse. I will count that wave as "a". The opportunity to go short will come with the completion of the "c" wave, which could take a day to play out.

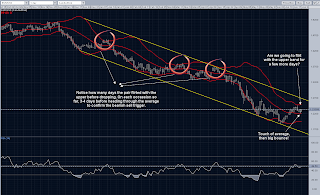
One potential blip in the bearish case is found on the daily bolliger band chart I have been showing lately. This is the fourth time since the downtrend began last November that we have touched the upper band. Each of the 3 times prior, we spent 3-4 days flirting with that level. Now, there is nothing that says we must have a repreat performance, however, since we did not break the average (midpoint) between the bands today, and instead, this area acted as resistance, it may mean either a very healthy retrace of this first wave down, or that we will head to new short term highs before a return to the bearish trend.

For now, we are well within common wave 2 retrace levels, with a 5 wave pattern behind us that leads the path ahead until proven wrong.

Tuesday, June 22, 2010

Whose afraid of a little debt... the Euro is.

A brief reflective look at the Euro.

Short term perspective first.

Last Thursday the post "Not Even Going to Try to Count This..." described an rally set in overlapping waves. Two charts posted, the first with no elliott wave counts posted (I really tried, but it was just too much of a mess... one of the reasons why I believe that this will be fully retraced eventually), listing a prediction of a bounce to the mid 1.25's. The second a touch of the upper bollinger band on the daily chart. Here is what they looked like:


The top tick ended up being 1.2513 (this may differ from what your market makers data tells you since the top tick happened on traditionally low volume Sunday afternoon), and we now have what is beginning to look like an impulsive wave as a retreat.

Here's the daily bollinger band today:

Notice the perfect touch of the upper. The technical trigger using this method is a cross of the moving average/midpoint, so we are not quite there yet using strictly the daily bollinger.

We may have just finished (presently in a wave 2 up) or are nearly finished (another dip for a wave 5) with the first impulse wave down...


Longer term...
On May 22nd, I posted "EUR/USD Downside target realized, and then some...". At that time, I was exploring a very bearish option that has us in a wave 3 down since last November. While I have since shifted my view to one that places us in a lesser bearish C wave (see "Updated Longer Term EUR/USD View"), the internals of 3 vs C are the same.... a five wave impulse wave. Here is the chart from that post speculating on how wave 1 of 3 (or the entirety of C) would finish up.


This turned out to be precisely what the market had in store for us up until now.


Notice the sharp retracement of wave [iv] noted into the mid 1.20's. I believed at the time that it would be sharp because of the tendancy of waves 2 and 4 to alternate. In this case, since wave [ii] was a flat, then probability favored wave [iv] being a sharper corrective rally, more like a zig zag. If wave [iv] is finished, it probably counts best as a double or triple zig zag, but whatever the count, it certainly fit the alternation tendancy that Elliott describes. If wave [iv] is not finished, and we break through 1.2513 on solid momentum, it will likely mean my count is wrong. This does not mean that the bearish trend is over, only that the internal subdivisions need more time to work themselves out. I still believe we will hit that lower green trendline (very speculative) before monting a more significant rally.


Thursday, June 17, 2010

Not even going to try to count this...

What a mess. Your guess is as good as mine on the count, but with overlapping waves all over the place, I categorize it as a correction. The wave may stop at the area circles, but need a 5 wave move down to confirm a top.

If we break through this area, we likely head up to upper bollinger band before the wave ends... in the mod 1.25's.


Ping your blog