Wednesday, May 26, 2010

Diverging RSI

Often, when there are conflicting elliott wave counts that are both likely, additional indicators such as RSI can help push the probability of one as "most likely" into the spotlight.

Today is one such instance.

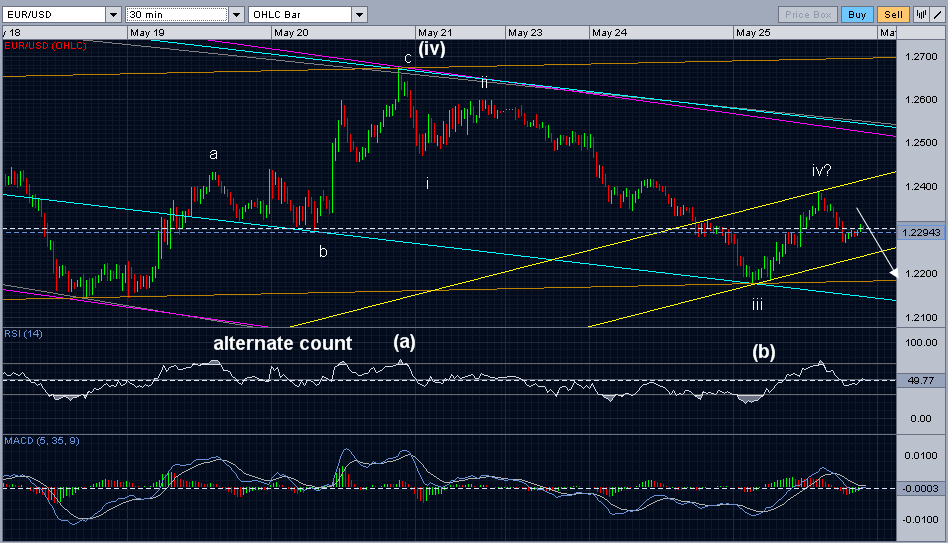
Yesterday's chart has two potential counts listed.

Thanks to diverging RSI while the Euro hit a new short term price low, I now have more confidence that the count listed today is squarely in the top spot. It is not that the alternate is not possible (it still is), it is simply that the primary is so much more likely.

Since we did not yet hit a new low and so far, the late afternoon rebound appears to be in 3 wave form, look to a new low after perhaps more consolidation up towards 1.24 (or maybe even higher) over the next few hours to a day in a wave 2 move. The alternate mentioned yesterday also has us rallying short term... a little higher though above 1.2675 to complete wave c of wave (iv) in a flat before the next bearish wave begins.

Tuesday, May 25, 2010

EUR/USD... Bottoms up!

The correction since the May 19th low counts clearly corrective as an ABC (or WXY if you prefer). The decline that has follow is so far only in 3 waves and has not yet hit new lows. Primary count I am following has us hitting a new low in a 5th wave before another change at a longer term correction. However, because the move down is so far only in 3 waves, an alternate count of a potential flat correction as a possibility which would have us moving higher is still on the table. A move below May 19th lows would eliminate this count, whil a move above 1.2340 would render the more bearish count highly improbable.

Keep in mind though, that even if the more short term bullish flat correction interpretation is correct, we eventually will find new lows. A move higher above last weeks high of 1.2671 in 5 waves, without hitting new lows under 1.214 would be yet another opportunity for the bears.


Ping your blog