Thursday, April 1, 2010

EUR/USD - 1st & 2nd Counts Head Higher for Now

Updated counts from today's action. A few key points:
1) The upside count does not look complete.
2) The blue trend channels I drew Wednesday may be a stopping point, if the ending diagonal 5th option (primary count shown) is in play (see yesterday's post)
3) I don't have significant confidence in the upper yellow short term channel. It may be higher than I have shown.

Bottom line is that since both primary and alternate counts head upwards, we should be looking that direction in the short term. I am watching for a touch off the upper blue channel, or a break of 1.3459 and then through 1.3385 prior to a touch to confirm the start of a next leg lower under the primary count.


EUR/USD - More short term upside possible.

I am remote today so no charts with this update. I will post an updated chart with elliott counts this evening when I get back to a computer. Take a look at yesterdays update, "Ending Diagonal Speculation". With the persistent number of buyers over the last few days, and what appears to be ABC moves in both directions, I am thinking that this may be the top pattern. Key to this (ending diagonal) option is that the rally does not turn into a 5 wave affair. If it does, odd favor that the entire bearish (dollar bullish) move from last November is over for now.I will be looking to potentially short the euro again should it get near the upper trendline shown in the ending diagonal post yesterday.

Wednesday, March 31, 2010

3 Options for Greece... All With Dire Consequences

Taken from the article Hans-Werner Sinn: 3 Options For Greece

"There are three bad alternatives. He recommends #3 (effectively, default):


1) A Franco-German bailout. Dr. Sinn believes this is impractical and the worst of the three alternatives because the amounts required for an effective bailout are so large that it would trigger a jump in yields on French and German sovereign debt which would result in a Euro-wide financial crisis. In addition, Angela Merkel said 'no,' and so did Guido Westerwelle (her coalition partner and foreign minister).

2) IMF loans. Dr. Sinn believes that this would accelerate the Greek economic contraction with a dramatic deflation of wages and prices, which could lead to civil war, revolution and a political destabilization of the area.

3) Exit the Euro zone, revive the Drachma, re-denominate the sovereign bonds in Drachma, let the Drachma collapse, and rebuild after the collapse, largely on tourist remittances Assuming a small amount of domestic (internal) default, this would be the least-painful to the Greek populace, but German banks and investors would lose approximately $38 Bn in bond investments +/- what can be recovered after the Greek economy recovers. Eventually, Greece would be allowed to re-join the EU."
 

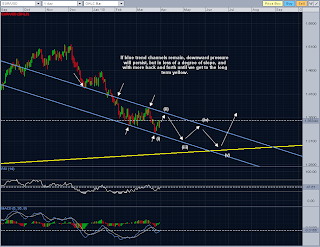
Ending Diagonal Speculation...

Taking a bit of time to indulge in future speculation surrounding how the market may fulfill the EUR/USD Long Term View Target from current levels.

The blue trend channel lines are distinct possibilities. Two touch points on the upper and lower channels so far (see analysis of triad indicators supplementing Elliott Wave), and an Elliott count that so far, counts best as 3 waves down to new lows (see 3/30/10 EUR/USD Elliott Wave count). This opens the door for a slop change and an ending diagonal for wave 5.

What do you think?

EUR/USD: The story remains the same...

Not much new to report. The primary count I am following is still intact showing us in a short term wave 2 of 5. The mention yesterday of a possible very short term 5 wave down was proven incorrect by the market this morning so it looks like prices will be heading toward 1.36 before completing wave 2 and entering the next leg down... wave 3.


See yesterday evening's post for the active euro elliott wave count:
3/30/10 EUR/USD Elliott Count

Caution should still be exercised due to the more bullish alternate being shown... that wave 5 is complete and we are entering a multi month rally that partially retraces the move down from 1.51+ that started last November. It would take a move above 1.3813 to confirm that this alternate more bullish scenario was in play, although a break of the upper trendline area surrounding 1.3650 would be an early warning sign.

Tuesday, March 30, 2010

EUR/USD Short Term Elliott Count Update

An update before we head into evening action. Short term counts have changed slightly, but message is the same.

Primary count is bearish... we likely have further on the downside before a more significant retracement of the price movement since last November highs (wave 2 up).

The alternate is that the downside is over for now, and we are in a multi-month rally that should retrace into the fibonacci zone.

The move up yesterday breached through where my wave 1 was at, eliminating the wave 4 count I was following, so the 1-2 count is now in play. The one I have posted is a 3 wave move down, which infers that the larger wave 5 will be an ending diagonal, but the move also can be counted as a full 5 waves down. For practical purposes, it doesnt matter how we count this, as the message is the same near term. We will have to watch for the true pattern to reveal itself with more time.

The move down down from overnight highs above 1.3535 is so far in 3 waves, but we need to watch carefully to see if it turns into 5 on the 15 min charts. If it does not hit a new low before breaching 1.3453 on the upside, then either a small degree wave 2 has higher to retrace, or the alternate, more bullish count is intact.

I have made an effort to draw preliminary trend channel support in red and white that may provide resistance and a stopping point should the latter happen, but do not have high confidence yet in these lines. This morning broke through the lower yellow trend channel I had drawn (see post), so I redrew based on the next available possibility.

I am waiting for now to see if the move on the 15 minute chart turns into a five wave pattern or not. If I were to speculate, I would say that the new lower will break, and we will be heading down to new lows. Major question on the table right now is whether this happens soon, or after a move up near red and white trendlines.

Supplementing Elliott - My Triad of Technical Tools

Taking a break from the regular posts and discussion surrounding the ins and outs of bullish or bearish longer term counts to focus on 3 supplemental technical indicators that lined up this morning on the 30 min EUR/USD charts, providing an excellent opportunity to hone in some trading skills.

The 3 indicators are:

Price Trend Channels - Lines drawn in parallel to each other connecting price peaks (upper line) and valleys (lower line). Helpful in determining potential price trending. Strongest trends indicated by 3 or more touchpoints on each channel, however, I have found that in the real world of trading, waiting until 3 touchpoints happen to enter a trade usually ends up in the trend changing. In Elliott wave, trend channels are absolutely invaluable in mapping out probable moves of impulsive and corrective moves alike.

Relative Strength Index (RSI) - A momentum indicator comparing the magnitude of losses to gains. Useful in determining overbought vs oversold conditions. Also very useful in determining the end of Elliott wave patterns by watching for places where prices reach new highs or new lows, but RSI does not follow (divergence). I use a fairly standard duration period of 14.

Moving Average Convergence/Divergence (MACD) - A momentum indicator using the diference between a shorter term and longer term moving average, and comparing to a "signal". Crosses of the signal by the moving average difference may be signalling a shift in momentum. I use duration periods of 5 and 35 for the moving averages, and a standard 9 for the signal. I find 5 and 35 work very well to determine momentum changes helpful in determining the most probable Elliott wave pattern in effect.

I use these "tools" so frequently in my Elliott wave analysis, that if one or two are not giving me a signal and my primary Elliott count is, I automatically lower the risk profile of my trade as a result. If none of them are firing me a signal and yet my Elliott count is, it typically means that my Elliott count is wrong. Is this case, I am usually in "wait" mode until signals start firing on these 3 or my Elliott count is proven incorrect.

Is it a perfect method? No way! No trading method is perfect all of the time if you trade professionally... no matter what those marketing it tell you. The best methods are those that assist you in managing risk, tell you to get out of positions with a sizable gain instead of a small gain, or a small loss instead of a big one.

Using these 3, I have found that false signals tend to be rare because of the use of all 3 plus the Elliott wave. More often, I anticipate the signals trying to jockey for a better price position for my trade, and the market winds up not giving me the signals that I anticipated. This last tendancy is my particular achilles heel in trading... I am often early. My 2009 trading results last year reflect both my use of these 3 indicators, Elliott Wave analysis, and my achilles heel.

Ok... on to the charts...


Todays action on the 30 min EUR/USD was a great example of Elliott wave, and the 3 signals firing off. Using the alternate Elliott wave count from yesterday which gave us a count that would eventually begin to retrace its move up from last week, and each of the indicators above, a clear signal is given. First in the RSI and MACD.... new highs in price with divergences, and a MACD rollover... followed by a trend channel break at about 1.3490. This was followed by a drop to 1.3395 after the 3 signals fired... 95 pips potential profit! And this without having positive confirmatiuon yet as to whether the very bearish allternate Elliott wave count is in play or not! The move down after the trend channel break looks like it may be a small degree wave 3, but in the meanwhile, I have a strong position to either wait for the Elliott count to take hold
(for longer term trading), or take profits if I am trading the short term charts only.

Later on today I will update the EUR/USD short term counts, likely with the alternate from yesterday shown above (bearish) as the primary, but want to wait until the action from today has time to tell us more of its secrets.

Monday, March 29, 2010

Forex Manipulation and the EUR/USD...

The spot Forex market is certainly not a place for the faint of heart. Over the weekend on Sunday, my primary broker/market maker opened for business as they usually do... at 10:00 AM Pacific Standard Time. PIP spread on the EUR/USD was set at 10 pips as it normally is. Volume was incredibly anemic during these times as there is no world market really even open yet... pre-market trading only.


Just before 11:00 AM, someone (or multiple someone's) decided to bid the EUR/USD up significantly, triggering both my EUR/USD sell positions and then my stop loss order within minutes. Of course, no other price feed was showing this sort of "spike", primarily because no world market was even open yet!


You win some, you lose some, right? This is precisely the reason why I do not advocate setting stop losses or take profit levels through automatic means. I am not saying that my broker/market maker engineered such a spike, but I always try to keep in mind that they make money off my transactions (in the form of spreads and interest on margin balances), AND they take the other side of my trade. If I win big on the trade, they lose. The system is set up with a natural bias toward the market maker. They know what levels my stop losses and take profits are at because they manage the system that accepts them. Again, I am NOT saying that I believe that my broker engineered this spike... I honestly have no idea whether they did or didn't. The spike could just as easily have been engineered by someone with significant leverage who had no affiliation with my broker. Pre-market, very low volume... you get the picture.


Needless to say, I will not be placing automatic orders anymore, or at the very least, not allowing them to live through off-market hours.


Off my rant now... onto the business at hand. Elliott wave count updates...


While the rally from last week persists, we still havent broken through the lower tip of wave (i). That keeps the primary count I posted still on the table. I am keeping it primary right now, but it certainly doesnt "feel" like a wave (iv). It is really long compared to wave (ii), and with todays back and forth action, appears to have further to go on the upside. It also doesnt appear to be a clean impulsive wave off the lows either, so I have taken the bullish case off the table as the alternate, and place the 1-2 series long shot that I posted last Friday as the alternate. I have also seen an ending fifth wave diagonal count potential pop up overnight, that should the rally continue in a 3 wave form and then turn back down, I would have to consider. I do not have much confidence in any of these structures right now, as there are issues with any count at the moment. What does seem to be probable though is that there is more downside left. The lack of a clear impulsive rally off the lows at least gives us this to work with.


Have a great week! Will post more soon.
    

Ping your blog