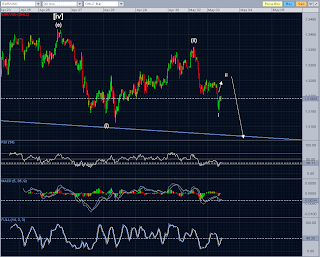
Here is the target and prediction I put forth on March 22nd. That we would hit the trendline near 1.289 in or around the mid-May timeframe. While it took wave 4 much longer to play out than was apparent on March 22nd, the market appears to be attracted to the lower trendline like a magnet.
Notice the yellow trendline support.
Here is where we are today. Notice the blue trendline that has held all price action for months is not broken to the downside. Yellow trend channel target dead ahead!!!
Shert term analysis in yesterdays post I mentioned an opportunity with a bounce to 1.3206-1.3250 to go short for a wave 3. Here is what the chart and count looked like yesterday...
As such, my best count is that we are in a wave iii of wave (iii) of wave [v] of wave 1, thrusting from a completed triangle, and on our way down to a touch of long time trend support. Wave iv and wave v are still ahead, but downside is now becoming limited before a much larger expected rally that could carry us to at least between 1.38 - 1.40 in a 3 wave correction of the entire move down from last November. This correction will serve to scare the now overcrowded, weaker shorts into long positions... just in time for wave 3.
Wave Principle Is Moving — Here’s Where to Find All Future Updates
-
If you’ve followed Wave Principle here over the years, thank you.
This blog has been home to a lot of Elliott Wave charts, trade breakdowns,
and market ...
2 months ago


