Monday, September 13, 2010

EUR/USD - Daily Gap Beggin for Some Love!

I know, I know... it has been awhile. It is still a very busy season for me, but thought I would take a few moments out to post what may be a solid opportunity forming in the EUR/USD pair. Gaps on the daily chart do not open up very often, and when they do, they are most often filled very quickly.

Will it be the case this time? I can't be sure with absolute certainty, but with today's large move having touched the daily upper bollinger bands with a daily gap up, I would be very very careful about buying into going long at this point. Looks like a scorcher to me!!!

Wednesday, June 23, 2010

Euro Update and Opportunity...

What seemed a bit tentative yesterday appears less so today.

I was looking for an impulsive 5 wave count, and while not the most perfect looking impulse, what appears to be an ending 5th wave thrust from a 4th wave triangle ended the wave has helped clear the picture and raise the odds a bit.


The spike up post Fed today is steep, and as I type, is close to being counted as a 5 wave impulse. I will count that wave as "a". The opportunity to go short will come with the completion of the "c" wave, which could take a day to play out.

One potential blip in the bearish case is found on the daily bolliger band chart I have been showing lately. This is the fourth time since the downtrend began last November that we have touched the upper band. Each of the 3 times prior, we spent 3-4 days flirting with that level. Now, there is nothing that says we must have a repreat performance, however, since we did not break the average (midpoint) between the bands today, and instead, this area acted as resistance, it may mean either a very healthy retrace of this first wave down, or that we will head to new short term highs before a return to the bearish trend.

For now, we are well within common wave 2 retrace levels, with a 5 wave pattern behind us that leads the path ahead until proven wrong.

Tuesday, June 22, 2010

Whose afraid of a little debt... the Euro is.

A brief reflective look at the Euro.

Short term perspective first.

Last Thursday the post "Not Even Going to Try to Count This..." described an rally set in overlapping waves. Two charts posted, the first with no elliott wave counts posted (I really tried, but it was just too much of a mess... one of the reasons why I believe that this will be fully retraced eventually), listing a prediction of a bounce to the mid 1.25's. The second a touch of the upper bollinger band on the daily chart. Here is what they looked like:


The top tick ended up being 1.2513 (this may differ from what your market makers data tells you since the top tick happened on traditionally low volume Sunday afternoon), and we now have what is beginning to look like an impulsive wave as a retreat.

Here's the daily bollinger band today:

Notice the perfect touch of the upper. The technical trigger using this method is a cross of the moving average/midpoint, so we are not quite there yet using strictly the daily bollinger.

We may have just finished (presently in a wave 2 up) or are nearly finished (another dip for a wave 5) with the first impulse wave down...


Longer term...
On May 22nd, I posted "EUR/USD Downside target realized, and then some...". At that time, I was exploring a very bearish option that has us in a wave 3 down since last November. While I have since shifted my view to one that places us in a lesser bearish C wave (see "Updated Longer Term EUR/USD View"), the internals of 3 vs C are the same.... a five wave impulse wave. Here is the chart from that post speculating on how wave 1 of 3 (or the entirety of C) would finish up.


This turned out to be precisely what the market had in store for us up until now.


Notice the sharp retracement of wave [iv] noted into the mid 1.20's. I believed at the time that it would be sharp because of the tendancy of waves 2 and 4 to alternate. In this case, since wave [ii] was a flat, then probability favored wave [iv] being a sharper corrective rally, more like a zig zag. If wave [iv] is finished, it probably counts best as a double or triple zig zag, but whatever the count, it certainly fit the alternation tendancy that Elliott describes. If wave [iv] is not finished, and we break through 1.2513 on solid momentum, it will likely mean my count is wrong. This does not mean that the bearish trend is over, only that the internal subdivisions need more time to work themselves out. I still believe we will hit that lower green trendline (very speculative) before monting a more significant rally.


Thursday, June 17, 2010

Not even going to try to count this...

What a mess. Your guess is as good as mine on the count, but with overlapping waves all over the place, I categorize it as a correction. The wave may stop at the area circles, but need a 5 wave move down to confirm a top.

If we break through this area, we likely head up to upper bollinger band before the wave ends... in the mod 1.25's.


Updated EUR/USD Long Term View

It has been almost a month since my last post. It is good to be back. While the business of trading continues, my time has been limited for posts due to vacation, illness, endurance training, house remodels, and other business ventures.

Needless to say, I have been a tad overbooked.

The market has been anything but unexciting during the past month. Before I get back into the shorter time periods, my longer term analysis is in need of a refresher.

Take a gander at the longer term view I posted back in March of this year.

The counts I described are all well intact, and with the latest month worth of price action, a count has moved into the forefront as most likely, that we are in an ABC correction down from early 2008 highs.

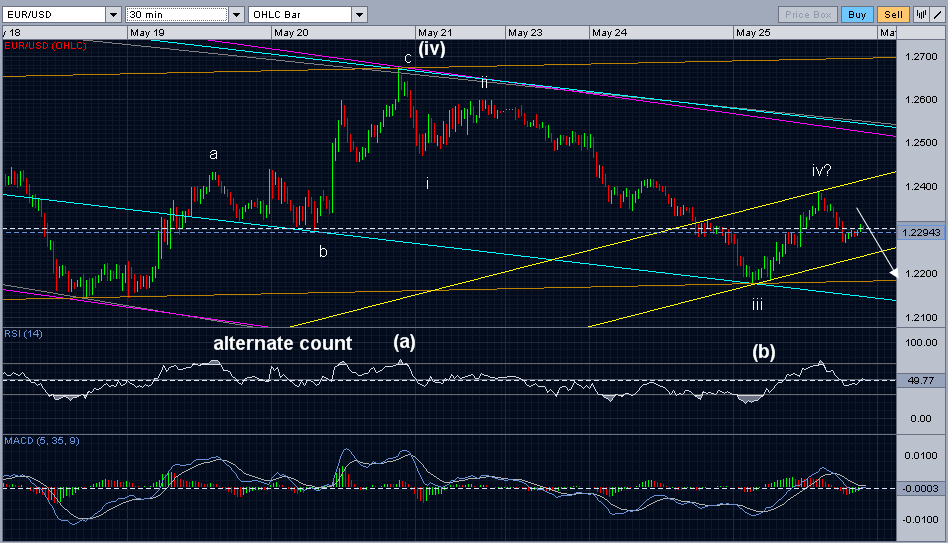
Because we have broken through below the end of wave A at 1.2328 it is entirely possible that the entire ABC correction is complete and that we are about to embark on a new bull market that will carry us to new highs. It is possible, but I do not believe it is the most probable scenario just yet.

The shorter term counts favor at least another dip to a low before bottoming, and the rally action over the last week or so looks corrective in nature... certainly persistant, but not impulsive. And we are still within the area of the previous 4th wave, a very common retracement area. No impulse means it is most likely corrective, and probably a 4th wave of the entire move down from last November highs. 


Additionally, notice the parallel trend lines (green) built off the highs of 2008 and late last year in the chart below. There is a cluster of support created by where this lower trendline crosses 61.8% retracement of the previous 5 wave rally to 2008 (1.1205), and the 78.6% fib fan from the previous 5 wave move intersects. This is an area that acted as support back in 1997-98 during a bear market. The other area I am watching is the low of late 2005 at 1.1659. Also important right in the middle of this price area is the point at which C equals A, 1.1434. There is a common equality relationship between the A and C waves in a correction, especially in a zig zag formation.

So, my target for wave C to end is between 1.1205 and 1.1659, with an emphasis on the area around the equality measure of 1.1434.

The alternate count is very, very bearish. If it is indeed the true count, the Euro is in for a very rough ride ahead, and may not survive the fall. This is the count that Prechter believes is in play. I am not quote ready to get that bearish yet. We'll explore that option in more detail if we cross below the previously cited major support areas.


Wednesday, May 26, 2010

Diverging RSI

Often, when there are conflicting elliott wave counts that are both likely, additional indicators such as RSI can help push the probability of one as "most likely" into the spotlight.

Today is one such instance.

Yesterday's chart has two potential counts listed.

Thanks to diverging RSI while the Euro hit a new short term price low, I now have more confidence that the count listed today is squarely in the top spot. It is not that the alternate is not possible (it still is), it is simply that the primary is so much more likely.

Since we did not yet hit a new low and so far, the late afternoon rebound appears to be in 3 wave form, look to a new low after perhaps more consolidation up towards 1.24 (or maybe even higher) over the next few hours to a day in a wave 2 move. The alternate mentioned yesterday also has us rallying short term... a little higher though above 1.2675 to complete wave c of wave (iv) in a flat before the next bearish wave begins.

Tuesday, May 25, 2010

EUR/USD... Bottoms up!

The correction since the May 19th low counts clearly corrective as an ABC (or WXY if you prefer). The decline that has follow is so far only in 3 waves and has not yet hit new lows. Primary count I am following has us hitting a new low in a 5th wave before another change at a longer term correction. However, because the move down is so far only in 3 waves, an alternate count of a potential flat correction as a possibility which would have us moving higher is still on the table. A move below May 19th lows would eliminate this count, whil a move above 1.2340 would render the more bearish count highly improbable.

Keep in mind though, that even if the more short term bullish flat correction interpretation is correct, we eventually will find new lows. A move higher above last weeks high of 1.2671 in 5 waves, without hitting new lows under 1.214 would be yet another opportunity for the bears.


Ping your blog