Tuesday, May 25, 2010

EUR/USD... Bottoms up!

The correction since the May 19th low counts clearly corrective as an ABC (or WXY if you prefer). The decline that has follow is so far only in 3 waves and has not yet hit new lows. Primary count I am following has us hitting a new low in a 5th wave before another change at a longer term correction. However, because the move down is so far only in 3 waves, an alternate count of a potential flat correction as a possibility which would have us moving higher is still on the table. A move below May 19th lows would eliminate this count, whil a move above 1.2340 would render the more bearish count highly improbable.

Keep in mind though, that even if the more short term bullish flat correction interpretation is correct, we eventually will find new lows. A move higher above last weeks high of 1.2671 in 5 waves, without hitting new lows under 1.214 would be yet another opportunity for the bears.


Thursday, May 20, 2010

Euro: Classic Elliott Wave Patterns

I have rarely seen elliott wave patterns so clear as they have been in playing out over the past months in the EUR/USD pair.

I have always found that elliott wave is easiest to trade where volume and volatility are present. Volume is needed to capture the largest social mood patterns, and volatility to amplify the patterns so that it is easier to see in real time. As the heaviest traded currency pair in the world the EUR/USD meets the volume characteristic needed, and the volatility over the past months due to the sovereign debt crisis surely has amplified the patterns.

The moves over the past 24 hours since my last post are no exception. The market has moved almost precisely as Elliott guidelines and wave patterns would indicate. Anyone who doubts that Elliott wave cannot assisst in helping narrow the possibilities of where the market should head, or just simply believes that markets are entirely random and unpredictable needs to see the past few days charts.

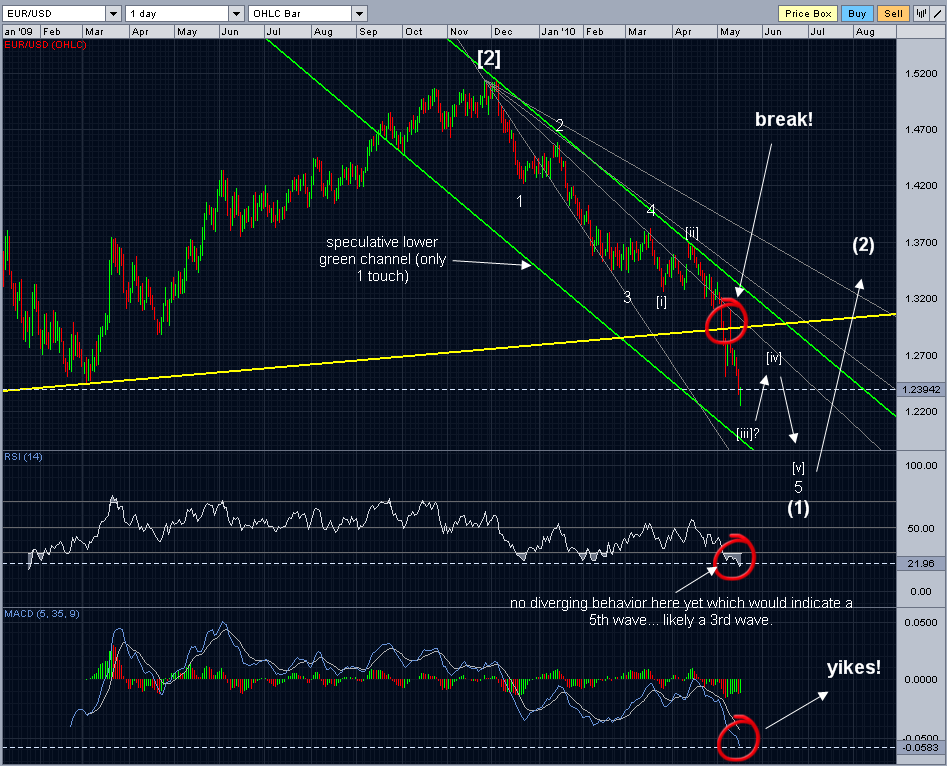
Yesterday had us in a clear 5 wave pattern off new lows for the EUR/USD (new 4 year lows in fact). Elliott wave analysis indicated that we should see a correction back to the area of the previous fourth wave and toward the common fib retrace area starting at 38%... followed by at least another 5 wave rally to new highs in a wave c or 3.

Here is yesterday's chart:

  
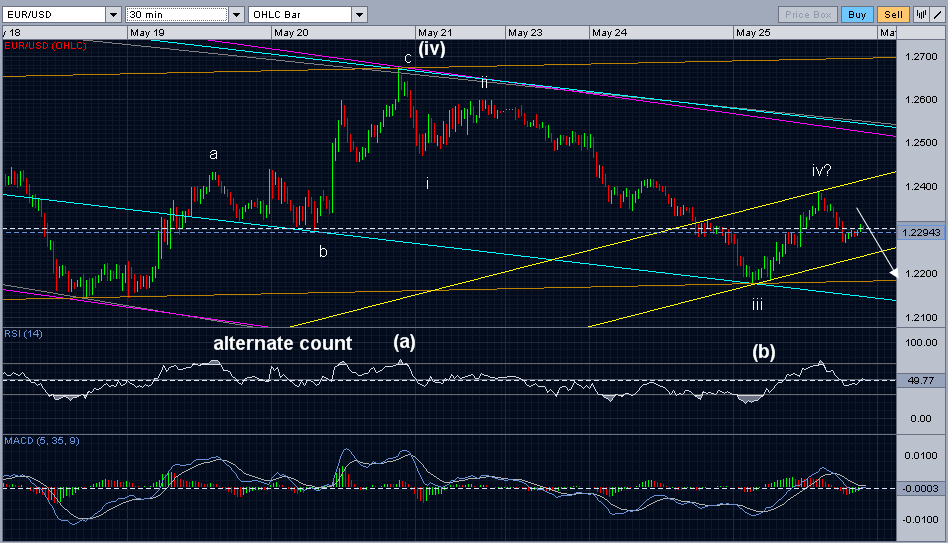
Here is today's chart:

The wave ii or b low of just below 1.23 is both within the are of the previous 4th wave, and squarely in the fibonacci zone. More important, is that its wave structure was overlapping in its form and in 3 waves. This was a significant clue that made going long near these levels relatively easy with defined risk (for me, the max risk I was willing to take was the end of the fib zone near 68% retrace level, but a wave 11 or b could have gone all the way to test the low and still have been valid, albeit much less probable). The reward happened as elliott wave predicted in a wave 3 or c move up to new highs.

Wave 3 or c is either over or has one more pop up to new highs before it is complete. Warning to the bulls though that the move down on the ultra short term charts can be counted as impulsive, so caution is needed.
Once wave 3 or c is completed (if it is not already), it becomes critical to watch the pattern of how the market corrects the move... if impulsive in 5 waves down, the we likely head to new lows before another shot at rallying. If in 3 overlapping waves, then we indeed be in a 4th wave and headed back up to complete the 5th wave of the move off the lows. Should the latter happen, it would mean a larger rally was unfolding, after a 3 wave correction.

Time to watch carefully and plan the next strategic trade...

I will be at a conference all day tommorrow, so no posts until next week. Good luck to you all and be careful out there. Volatility and risk are back in full force! 


Wednesday, May 19, 2010

Euro - 5 waves down followed by 5 waves up

 Yesterdays post warned that 5 waves down on the hourly charts was nearly complete and that we would likely be heading for a rally to at least correct the impulse wave down occuring since 1.304. The post proved timely as within the hour the EUR/USD began rallying. The post also mentioned the fiurst significant support at the area surrounding 1.2425.

The rally appears to have completed or nearly completed 5 small degree waves up, and has stalled near 1.2425. This indicates that the trend at some degree has changed. To what degree is unknown. I have placed both options for counts on today's chart, but we will have to wait and see. Until then, I will keep laser focused on the short term charts for hints either way. Until then, we are in for a correction of the EUR/USD rally likely to fib areas which also fall in the price area of the rallies 4th wave. For those of you who are new to Elliott wave analysis, this is a common retracement area for 2nd waves, so I will be watching this area for support. If I was still short, this would be a respectible area for me to exit my shorts and either wait for more clues or go long for the next wave up (whether it is a c wave or 3 wave doesnt matter to us very short term traders).

My gut and the fact that the latest low was not accompanied by a decent RSI divergence has me leaning toward the ABC option for this rally (more downside to come before a more significant rally), but I will let the market show me the way.


Tuesday, May 18, 2010

EUR/USD - 5 Small Degree Waves Down...

Forecast yesterday was right on as we plunged into a new low this morning.

I can count 5 waves down as being completed or very close to being completed since last weeks high of 1.3094 on the hourly charts for EUR/USD. So, irregardless of the larger counts, we are very near at least a break in the downward trend for now. Still no sign (five wave impulse upward on any timeframe) of a bottom as of this writing however.


Previous fourth wave area surrounding 1.2425 will be the first siginificant resistance for any bounce to encounter.

As for me, I am watching and waiting for the structure of any bounces that develop. It is time for caution and risk to prevail.

Monday, May 17, 2010

EUR/USD Downside target realized, and then some...

Back from a very restful vacation taken during one of the most volatile times in the market in memory. Equity markets dropping 9%+ in a matter of minutes a week ago Thursday, and the Euro seemingly freefalling through support levels of the past few years.

I must admit, I did keep an eye on the markets, and even placed a few short positions in the EUR/USD... I couldn't resist. No posts though... had to keep my family commitments first!

Clearly, the Euro has blown clearly through the target of 1.289 in mid-May I had posted back in March... and it did so without much resistance at all, which throws the entire idea of a lower yellow trendline (shown for the last time below) holding back selling pressure. And this morning, another breakthrough to 4 year lows! What a time to take a vacation!

Since it has been awhile since I have posted my position on elliott wave counts on the EUR/USD, rather than dive right back into the short term charts, I thought I would get back into the swing of things with an update on the minor degree count I think is most probable governing the trend since last November, and speculate a bit about where I see the market possibly moving from here.


The biggest change in the minor count I am following is that it appears that wave 5 is extending. It is very common for 1 wave to extend in an impulsive wave, and since wave 1 and wave 3 are nearly equal, it is ideal for me in identifying the larger wave structure that wave 5 extends because the presence of an extension reinforces that we are indeed in an impulsive wave. 

There are certainly other more bearish counts from some very smart analysts. One of which has us in the throws of an intermediate wave 3 after a series of 1-2's. I would rather not go into the pro's and con's of other views right now, and would rather stick with the one that has made the most sense to me along the way beginning, and has worked out very well for trading purposes.

This count has some more downside ahead moving toward a completion of 5 minor waves down (intermediate 1 wave completion), which I speculate will be followed by an intermediate wave 2 that if it is an ideal second wave, should last for a few months and take us into the most common retracement fibonacci levels and end within the previous minor wave 4 price range.
  

Tuesday, May 4, 2010

Longer term view prediction getting closer...

Here is the target and prediction I put forth on March 22nd. That we would hit the trendline near 1.289 in or around the mid-May timeframe. While it took wave 4 much longer to play out than was apparent on March 22nd, the market appears to be attracted to the lower trendline like a magnet.


Notice the yellow trendline support.

Here is where we are today. Notice the blue trendline that has held all price action for months is not broken to the downside. Yellow trend channel target dead ahead!!!


Shert term analysis in yesterdays post I mentioned an opportunity with a bounce to 1.3206-1.3250 to go short for a wave 3. Here is what the chart and count looked like yesterday...


As such, my best count is that we are in a wave iii of wave (iii) of wave [v] of wave 1, thrusting from a completed triangle, and on our way down to a touch of long time trend support. Wave iv and wave v are still ahead, but downside is now becoming limited before a much larger expected rally that could carry us to at least between 1.38 - 1.40 in a 3 wave correction of the entire move down from last November. This correction will serve to scare the now overcrowded, weaker shorts into long positions... just in time for wave 3.

Monday, May 3, 2010

A week later... Euro still declining

My apologies for no posts in a week. Unfortunately, I got hit with a viral bus in the shape of acute bronchitis and laryngitis... a very nasty combo. Almost as nasty as the combo punch that continues to decimate every Euro rally since last November. And if Elliott wave counts are correct, we still have a bit more to go on the downside before a more sustainable rally to correct the primary trend down.

Last Monday I mentioned that a new low was likely. Sure enough, we did hit a new low shortly after. On Friday, April 23rd post, I had posted that there were 2 counts that were most probable to explain the price action over the last month and a half... an ending diagonal 5th wave or a diagonal (or some call triangle) 4th wave... with the diagonal 4th as the most probable.

Today's short term action still has both firmly on the table and the likelyhood of new lows is clearly ahead of us. Here's the primary count I am following:


This has us in a wave ii of wave (iii) of wave [v]. Wave ii could take us near support in the prior fourth wave of 1.3206 - 1.3250, but it would take a break of last nights high of 1.3362 to move to the alternate, still bearish option of an ending diagonal 5th wave. The only difference in the alternate is some additional upside, likely to near 1.3450 prior to dropping down for a new low. A solid risk/reward opportunity on the short side is presenting itself with a near term bounce in 3 waves.

Although the short term is pointing clearly down, we are quickly heading into a time where a longer lasting bounce may be around the corner. My longer term EUR/USD model is still in play, and I fully expect a significant bounce to begin off the lower support trendline. The trend is down, but moving to a more cautious stance soon is certainly called for and wise.


Ping your blog